


Everyday Data Visualization
Everyday Data Visualization
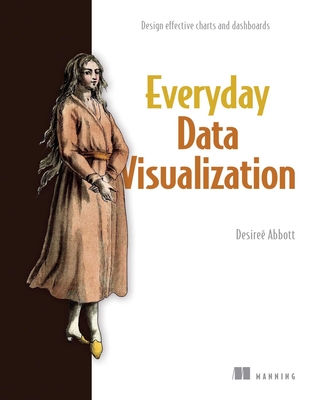
Everyday Data Visualization is a field guide for design techniques that will improve the charts, reports, and data dashboards you build every day. The foundation of data visualization is storytelling, and this book gives you the tools you need to start telling those stories with clarity, precision, and flair! You'll learn how human brains perceive and process information, master modern accessibility standards, get the basics of color theory and typography, and more! Purchase of the print book includes a free eBook in PDF and ePub formats from Manning Publications. About the technology Effective data visualization is about clear and thoughtful communication. A data visualizer goes beyond flat numbers to illuminate critical insights. Great data storytelling includes skills like attracting the reader's attention to the important points, accurately compensating for missing information, and adapting presentations to a live data flow. About the book Everyday Data Visualization gives you skills you'll use to enhance the most common data visualizations, including charts and tables, data dashboards, and infographics. You'll learn how to use color, typography, positioning, and choice of charts to catch and keep a viewer's attention. Discover the finesse and design rigor that goes into building delightful dashboards, and best practices for live visualizations that flex and grow as underlying data changes. Design fundamentals are broken down into their component parts so they're easy to understand--even if you're the analytical type! Best of all, everything you learn is tool-agnostic, with universal principles you can apply to any data stack. About the reader For readers experienced with data analysis tools. About the author Desireé Abbott has over a decade of experience in product analytics, business intelligence, science, design, and software engineering.
PRP: 424.92 Lei
Acesta este Pretul Recomandat de Producator. Pretul de vanzare al produsului este afisat mai jos.
382.43Lei
382.43Lei
424.92 LeiPrimesti 382 puncte

Livrare in 2-4 saptamani
Descrierea produsului
Everyday Data Visualization is a field guide for design techniques that will improve the charts, reports, and data dashboards you build every day. The foundation of data visualization is storytelling, and this book gives you the tools you need to start telling those stories with clarity, precision, and flair! You'll learn how human brains perceive and process information, master modern accessibility standards, get the basics of color theory and typography, and more! Purchase of the print book includes a free eBook in PDF and ePub formats from Manning Publications. About the technology Effective data visualization is about clear and thoughtful communication. A data visualizer goes beyond flat numbers to illuminate critical insights. Great data storytelling includes skills like attracting the reader's attention to the important points, accurately compensating for missing information, and adapting presentations to a live data flow. About the book Everyday Data Visualization gives you skills you'll use to enhance the most common data visualizations, including charts and tables, data dashboards, and infographics. You'll learn how to use color, typography, positioning, and choice of charts to catch and keep a viewer's attention. Discover the finesse and design rigor that goes into building delightful dashboards, and best practices for live visualizations that flex and grow as underlying data changes. Design fundamentals are broken down into their component parts so they're easy to understand--even if you're the analytical type! Best of all, everything you learn is tool-agnostic, with universal principles you can apply to any data stack. About the reader For readers experienced with data analysis tools. About the author Desireé Abbott has over a decade of experience in product analytics, business intelligence, science, design, and software engineering.
Detaliile produsului
S-ar putea sa-ti placa si
-
PRP: 237.93 Lei
214.14 Lei
214.14 Lei237.93 Lei
-
PRP: 351.25 Lei
316.12 Lei
316.12 Lei351.25 Lei
-

PRP: 217.48 Lei
195.73 Lei
195.73 Lei217.48 Lei
-
PRP: 264.47 Lei
238.02 Lei
238.02 Lei264.47 Lei
-
PRP: 210.73 Lei
189.66 Lei
189.66 Lei210.73 Lei
-
PRP: 217.51 Lei
195.76 Lei
195.76 Lei217.51 Lei
-
PRP: 136.34 Lei
122.71 Lei
122.71 Lei136.34 Lei
-
PRP: 362.58 Lei
326.32 Lei
326.32 Lei362.58 Lei
-
PRP: 307.33 Lei
276.60 Lei
276.60 Lei307.33 Lei
-

PRP: 309.94 Lei
278.95 Lei
278.95 Lei309.94 Lei
-

PRP: 322.32 Lei
290.09 Lei
290.09 Lei322.32 Lei
-
PRP: 309.94 Lei
278.95 Lei
278.95 Lei309.94 Lei
-
PRP: 100.36 Lei
90.32 Lei
90.32 Lei100.36 Lei
-
PRP: 258.33 Lei
232.50 Lei
232.50 Lei258.33 Lei
-
PRP: 244.71 Lei
220.24 Lei
220.24 Lei244.71 Lei
-
PRP: 387.50 Lei
348.75 Lei
348.75 Lei387.50 Lei
-
PRP: 68.97 Lei
62.07 Lei
62.07 Lei68.97 Lei
-
PRP: 266.54 Lei
239.89 Lei
239.89 Lei266.54 Lei


